
Oil Production (bbl/d)

2007 |
|
|---|---|
 Bakken Bakken |
74,173 |
 Eagle Ford Eagle Ford |
59 |
 Niobrara Niobrara |
35,940 |
 Permian Permian |
199,073 |
| Other Shale | 117,812 |
| Total Shale | 427,777 |
| U.S. Non-shale | 4,649,223 |
| Total U.S. | 5,077,000 |


2014 |
|
|---|---|
| Bakken |
1,077,444 |
| Eagle Ford |
1,360,266 |
| Niobrara |
217,510 |
| Permian |
970,894 |
| Other Shale | 293,041 |
| Total Shale | 3,919,154 |
| U.S. Non-shale | 4,662,119 |
| Total U.S. | 8,581,273 |
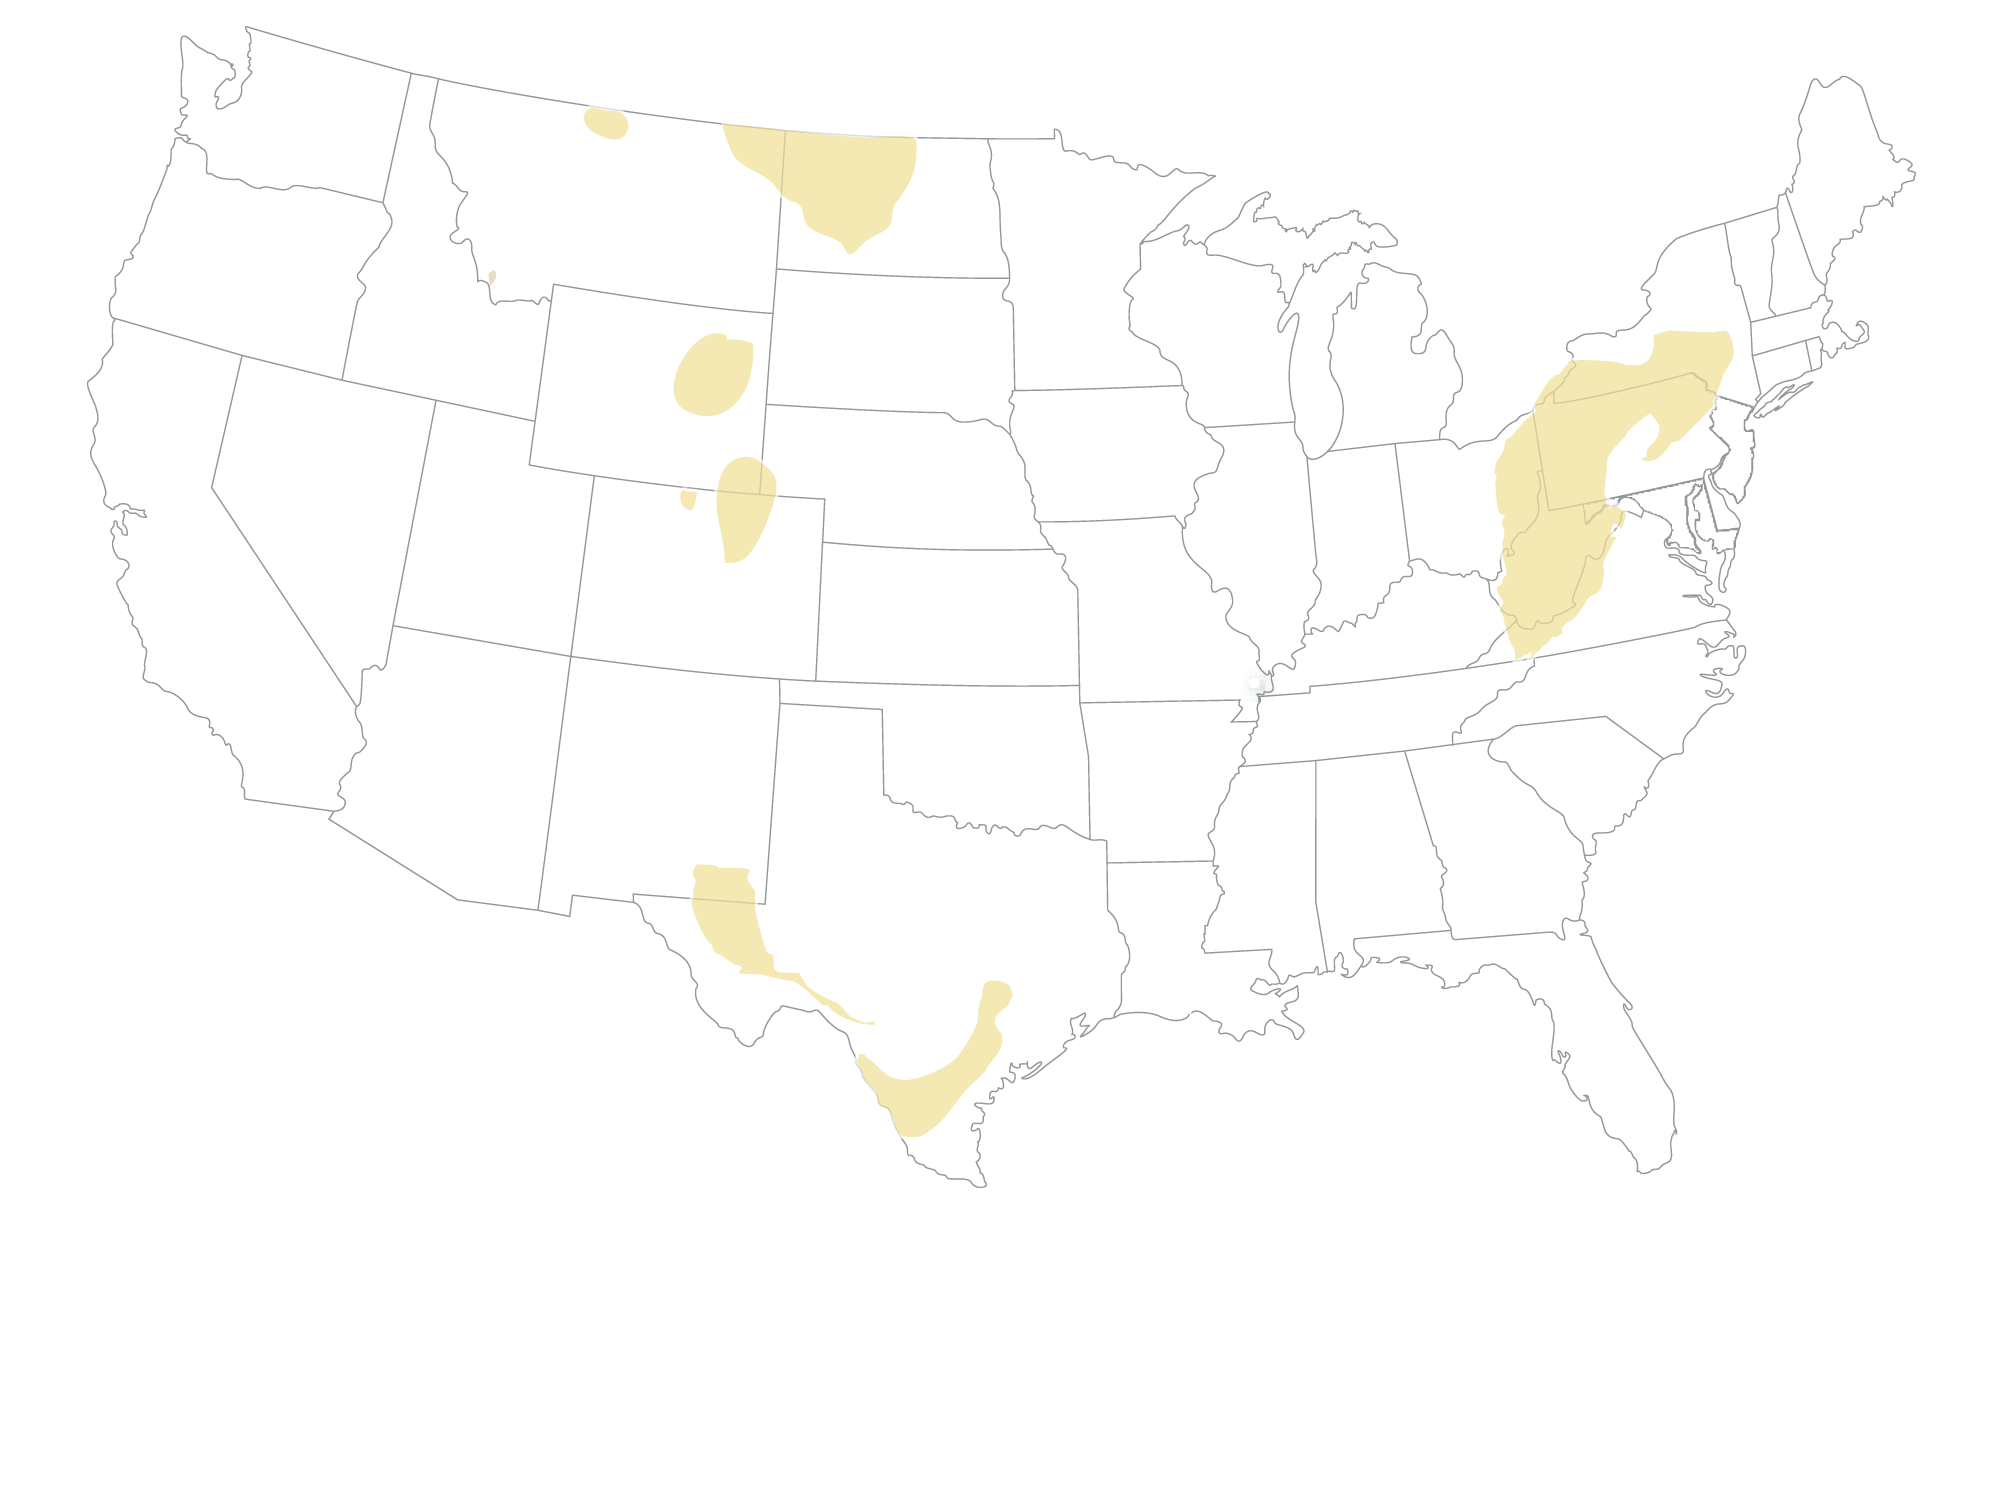
In 2007, the start of America’s shale oil production revolution, U.S. oil production was only about 5 million barrels per day. Since then U.S. oil production has increased almost 70%. Most of this increase is due to shale oil production, which has risen from less than half a million barrels per day in 2007 to almost 4 million barrels per day in 2014, constituting 46% of U.S. oil production in 2014.
Printable Version: Oil Production